This article presents the new regional economic areas defined by the Bureau of Economic Analysis (BEA) and discusses the procedures used to arrive at this disaggregation of the Nation on an economic basis.[1] The new disaggregation has 172 economic areas, and it replaces the 183-area disaggregation that BEA first defined in 1977 and then revised slightly in 1983 (Table 1, Chart 1 and Chart 2). The redefinition was undertaken in 1993, largely to incorporate newly available information on commuting patterns.[2]
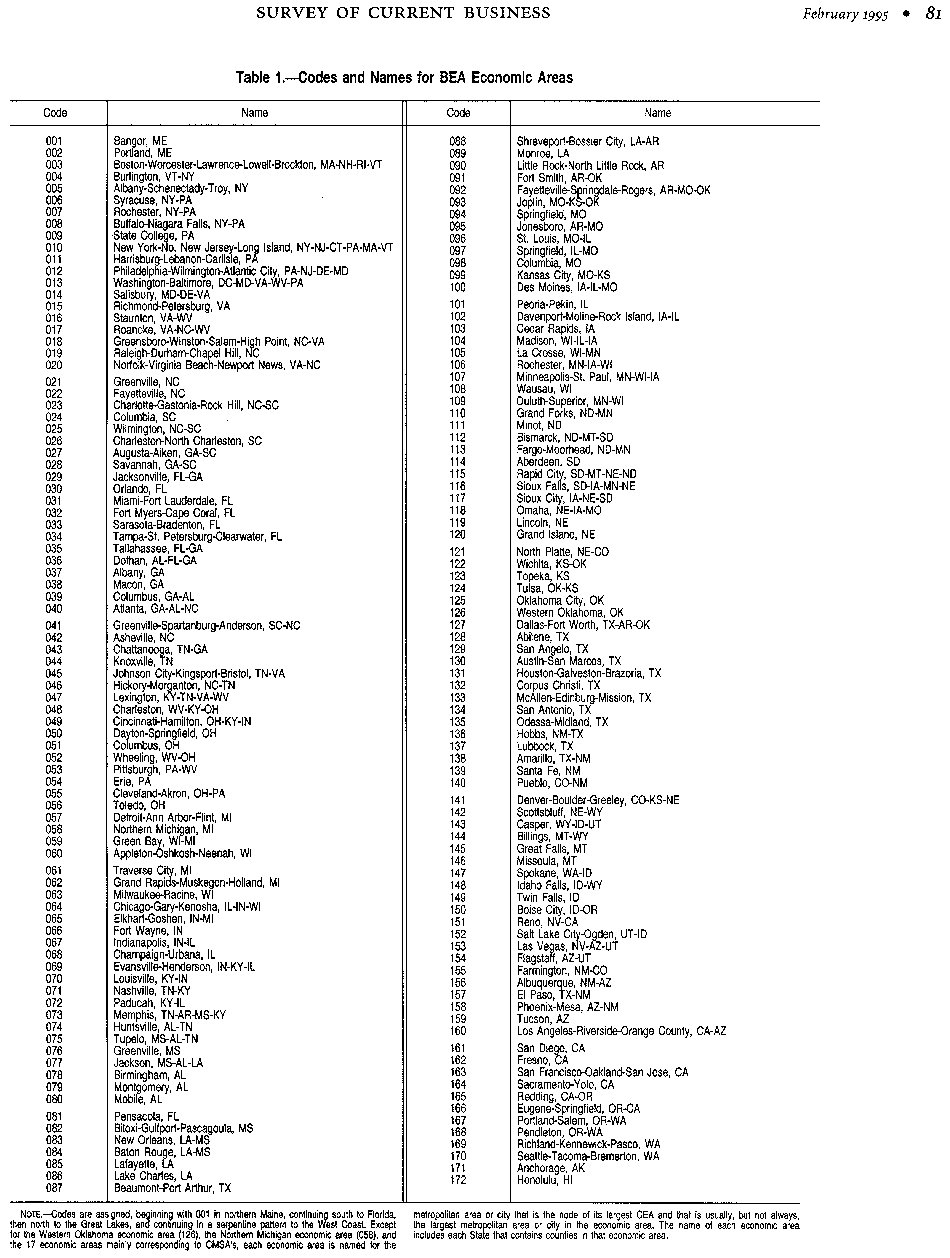
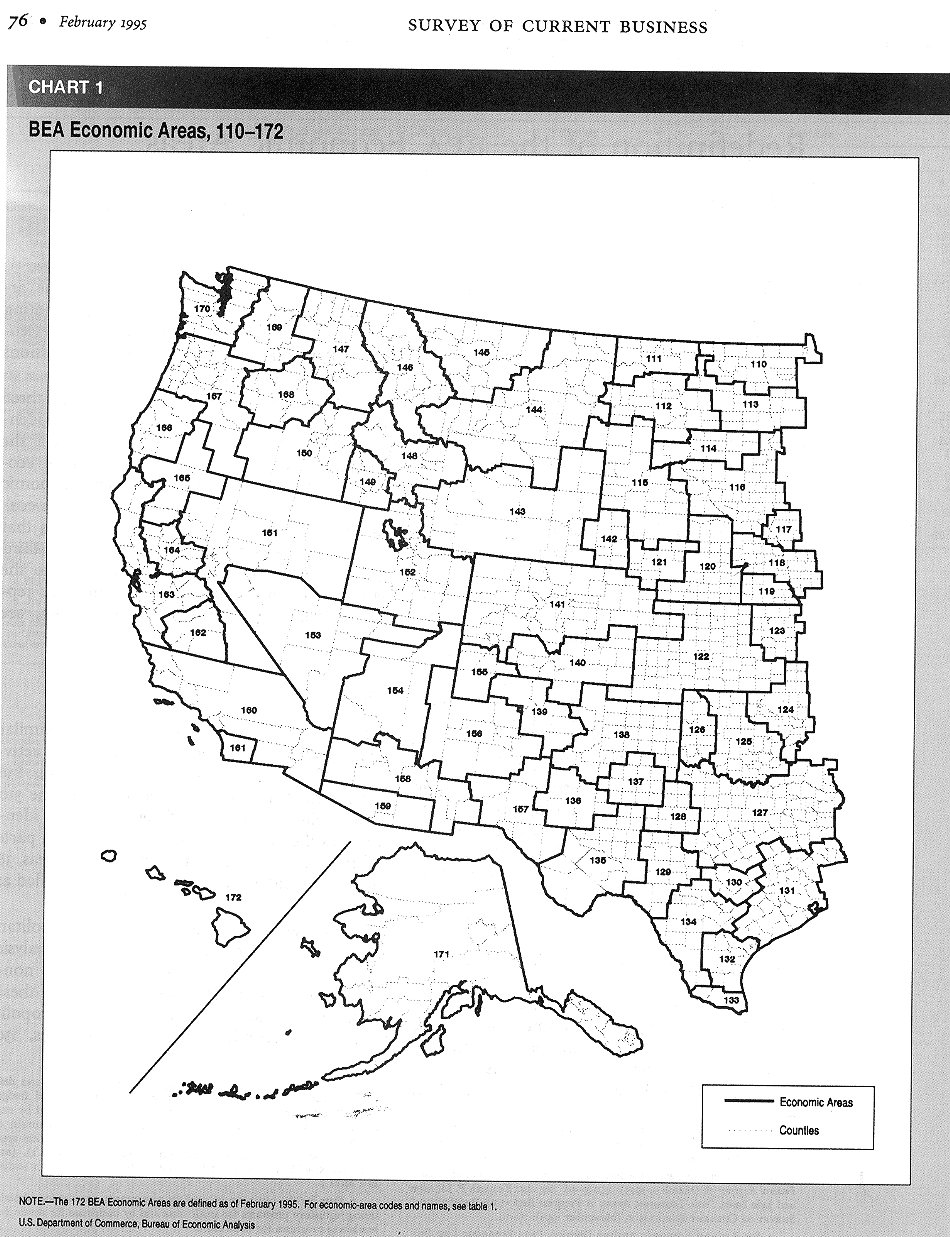
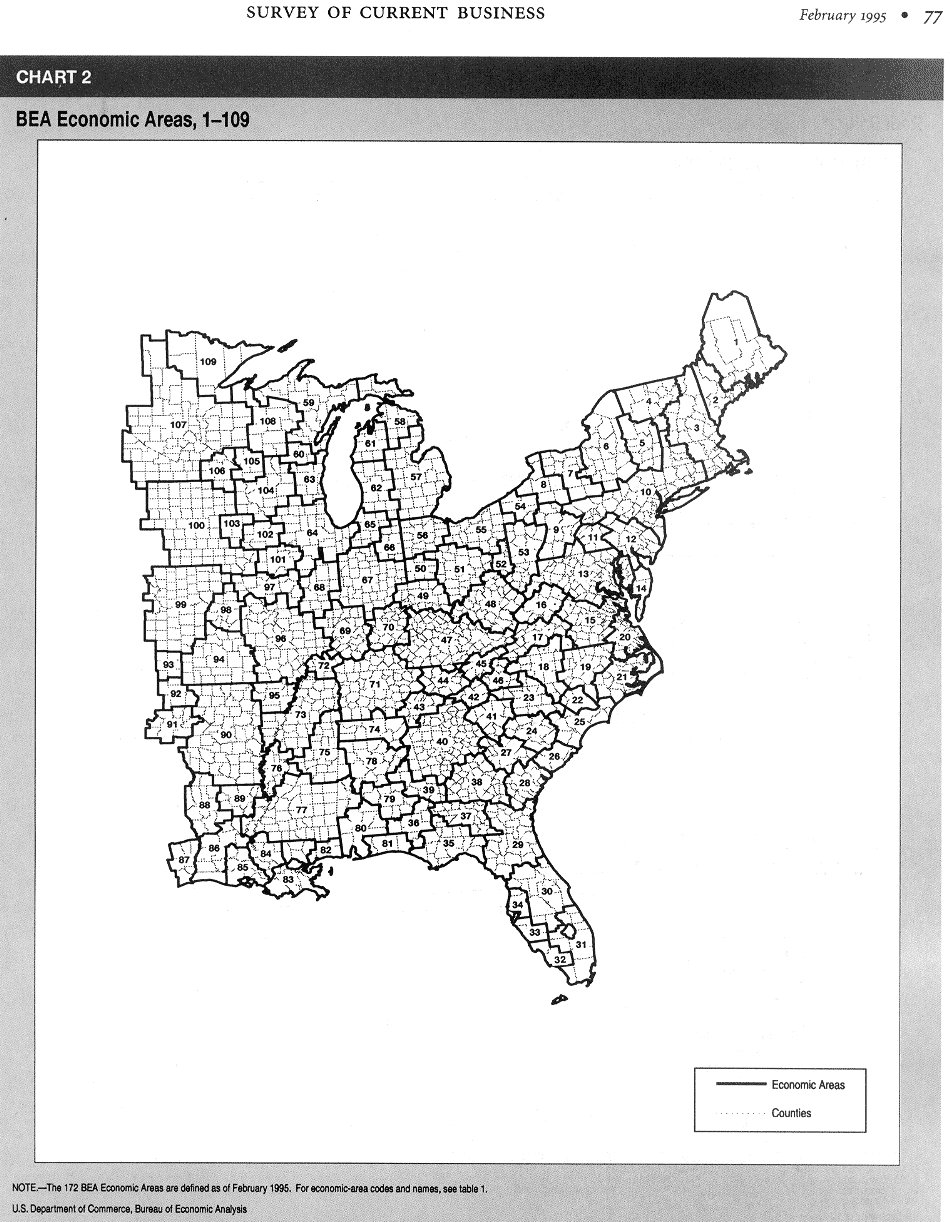
To facilitate regional economic analysis, BEA provides geographically detailed economic data by economic area, as well as by State and by local area. BEA assembles economic area data on earnings by industry, employment by industry, total personal income, population, and per capita personal income. These data may be used to analyze local economic activity, local interindustry economic relationships, and interarea population movements. In addition, the areas are used as major units for BEA's local area economic projections.[3] Historical and projected economic area data are used by government agencies for planning public-sector projects and programs, by businesses for determining plant locations and sales territories, and by university and other research groups for doing regional economic studies.
Each economic area consists of one or more economic nodes - metropolitan areas or similar areas that serve as centers of economic activity - and the surrounding counties that are economically related to the nodes. The main factor used in determining the economic relationships among the counties is commuting patterns, so each economic area includes as far as possible, the place of work and the place of residence of its labor force. The decision to redefine the areas reflects substantial changes in the commuting patterns, as indicated by data from the 1990 Census of Population, and changes in the definitions of metropolitan areas.[4]
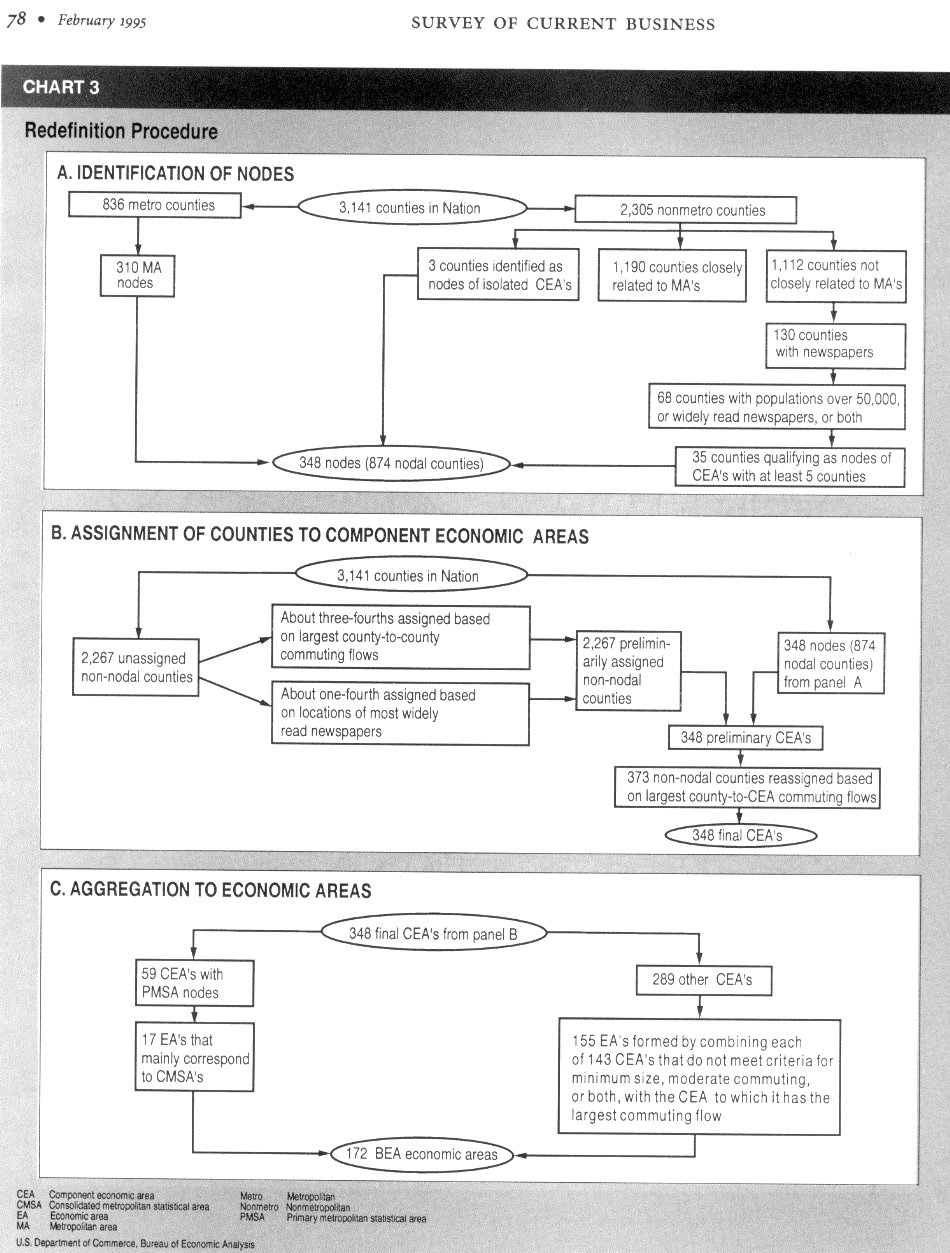
In general, the redefinition procedure has three major elements. The first element is the identification of nodes. The second element is the assignment of counties to relatively small economic units known as "component economic areas" (CEA's); each CEA consists of a single economic node and the surrounding counties that are economically related to the node.[5] The third element is the aggregation of the CEA's to the larger economic areas. For a diagrammatic representation of the redefinition procedure, see Chart 3.
[Footnotes]:
1. see "Proposed Redefinition of the BEA Economic Areas," Federal Register 59 (November 7, 1994): 55,416-20; and "Final Redefinition of the BEA Economic Areas," Federal Register 60 (March 10,1995): 13,114-18.
2. see "Intent to Revise the Boundaries of the BEA Economic Areas," Federal Register 58 (March 9, 1993): 13,049-50. See also Kenneth P. Johnson and Lyle Spatz, "BEA Economic Areas: A Progress Report on Redefinition," Survey of Current Business 73 (November, 1993): 77-79.
3. see Regional Economic Analysis Division, "BEA Economic Area Projections of Income, Employment, and Population to the Year 2000," Survey of Current Business 70 (November, 1990): 39-43.
4. The redefinition reflects the changes in the metropolitan-area definitions issued in June, 1993 by the Office of Management and Budget for statistical purposes; the definitions of metropolitan areas used by BEA are the county-based definitions. The 310 metropolitan areas consist of 240 metropolitan statistical areas (MSA's), 59 primary metropolitan statistical areas (PMSA's), and 11 New England county metropolitan areas (NECMA's). (BEA treats the New Haven-Bridgeport-Stamford-Danbury-Waterbury, CT NECMA as a PMSA.)
5. Data for the CEA's can be used by government agencies for administering regulatory programs for small areas and by businesses for developing marketing programs for small areas.
6. The 3,141 counties are those defined as of January 1, 1990; they consist of counties and of areas classified as county equivalents for the 1990 census.
7. Data by county on newspaper publication and circulation are from the Audit Bureau of Circulations, an organization whose membership accounts for about 98 percent of U.S. newspaper circulation.
8. The cities are Flagstaff, AZ; Jonesboro, AR; Idaho Falls, ID; Twin Falls, ID; Quincy, IL; Manhattan, KS; Paducah, KY; Bowling Green, KY; Salisbury, MD; Traverse City, MI; Marquette, MI; Mankato, MN; Worthington, MN; Hattiesburg, MS; Meridian, MS; Tupelo, MS; Greenville, MS; Missoula, MT; Butte, MT; Grand Island, NE; North Platte, NE; Norfolk, NE; Scottsbluff, NE; Lebanon, NH; Hobbs, NM; Farmington, NM; Minot, ND; Pendleton, OR; Aberdeen, SD; Watertown, SD; Cookeville, TN; Lufkin, TX; Staunton, VA; Clarksburg, WV; and Bluefield, WV. Hattiesburg, MS was defined as a metropolitan statistical area by the Office of Management and Budget in mid-1994, after the redefinition was under way (see footnote 4).
9. The preliminary assignment of a small number of counties with special features, such as unusually small populations, was based on other procedures.
10. In its forthcoming set of regional projections, BEA plans to publish projections for States in the summer of 1995 and projections for the new economic areas and for metropolitan areas in early 1996.
11. A CMSA has more than 1 million residents and comprises two or more PMSA's.
12. The criteria for minimum size were developed from a combination of data on land area, on number of employed residents, and on number of counties, and the commuting criteria were developed from journey-to-work data from the 1990 census.
13. The net number of commuters is the difference between the number of in-commuters (nonresidents who commute to work in an economic area) and the number of out-commuters (residents who commute to work out or an economic area).
14. The net commuting rate is the difference bweteen the in-commuting rate and the out-commuting rate; the rate of in-commuting (or out-commuting) is the number of in-commuters (or out-commuters) as a percentage of the number of employed residents, regardless of their place of work.
15. In the early 1980's, when definitions of the 183 areas were confirmed on the basis of commuting data from the 1980 census, about 80 percent of the 183 areas then had net commuting rates of 1 percent or less.
Survey of Current Business
February, 1995
pages 75-80
|
Back to Sacramento Forecast Project Update: June 27, 2005 jensena@csus.edu College of Business Administration California State University, Sacramento Disclaimer: Professor Arthur N. Jensen takes full responsibility for the information posted. The information on this page represents that of Professor Arthur N. Jensen and not that of California State University, Sacramento. [as required in PM BA 96-13 Policy on CSUSInfo World Wide Web] |